Urban Flooding in Lawrence
The City of Lawrence is developing a Stormwater Resilience Plan to reduce flooding and water pollution. Central to the plan is developing digital tools to help Lawrence’s Water and Sewer Department accurately simulate how the City’s sewer system responds to major storms. This page explores the importance of one of the digital tools being developed to identify solutions to the flooding problems throughout the City.
In 2025, the City developed an initial hydrologic (how much flow) and hydraulic (how deep) computer model. The model is a digital representation of the City’s stormwater sewer system and combined sewer system, and the City is using it to simulate what happens during a range of rainfall events in neighborhoods throughout the city. The intent of this model is to understand where the water will go and when it will get there.
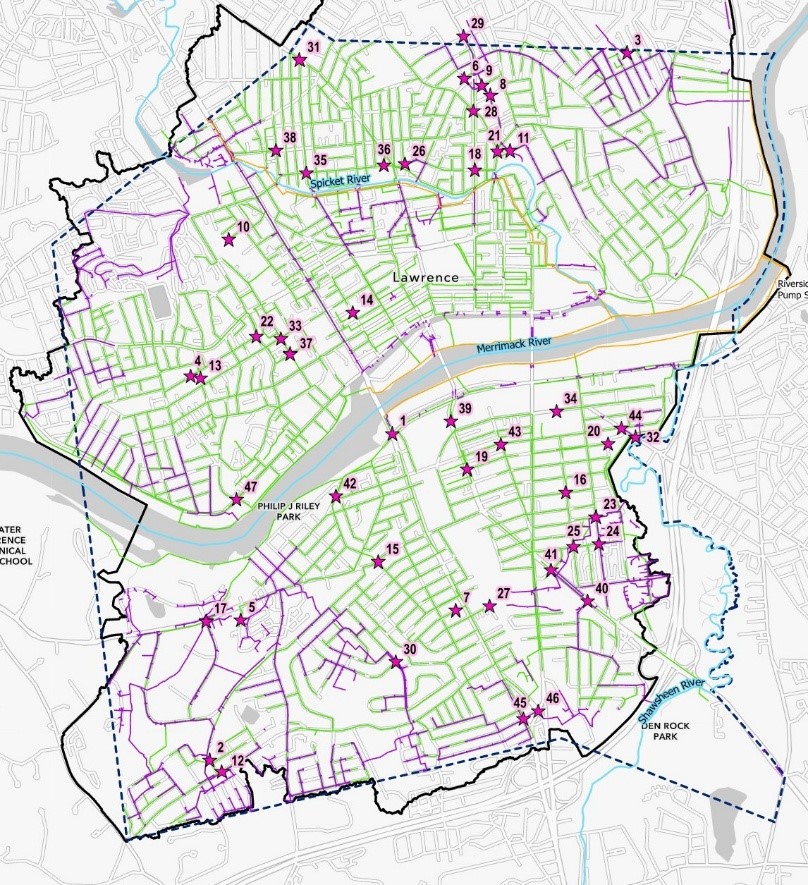
 Lawrence’s Complex Stormwater and Sewer Pipe Network
Now that the initial model is developed, the City team is using meters installed into the stormwater drainage system over the past year that measure actual water flow during rain events. These meters measure water depth and velocity in the pipes. This information is used to calculate flow rates that can be compared to the results of the simulations. This helps confirm that the model results are accurate.
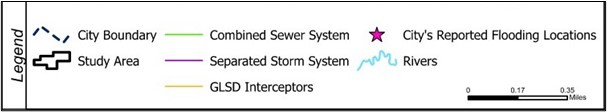
The flow assessment team is preparing to install equipment into the subsurface stormwater drainage system. Gentleman in the hard hat is putting on hip waders and a harness, getting ready to be attached to the tripod and lowered into the manhole to perform the installation. The boxes are Area Velocity meters with cabling going to a mounting ring. This equipment is installed and left in place over a period of months to capture information during rain events.
Taking a closer look at the Grafton Street neighborhood.
Before we take a closer look at stormwater in south Lawrence east we need to understand how stormwater behaves in general. Stormwater is water from rain or melted snow that flows into the street or storm drains instead of soaking into the ground. In the city, rain hits hard surfaces like roads, driveways, and roofs. Since it can’t soak into the ground, it “runs off” toward the lowest point. This runoff is collected by catch basins and then flows into stormwater sewers designed to manage runoff or combined sewers designed to manage sanitary waste and runoff.
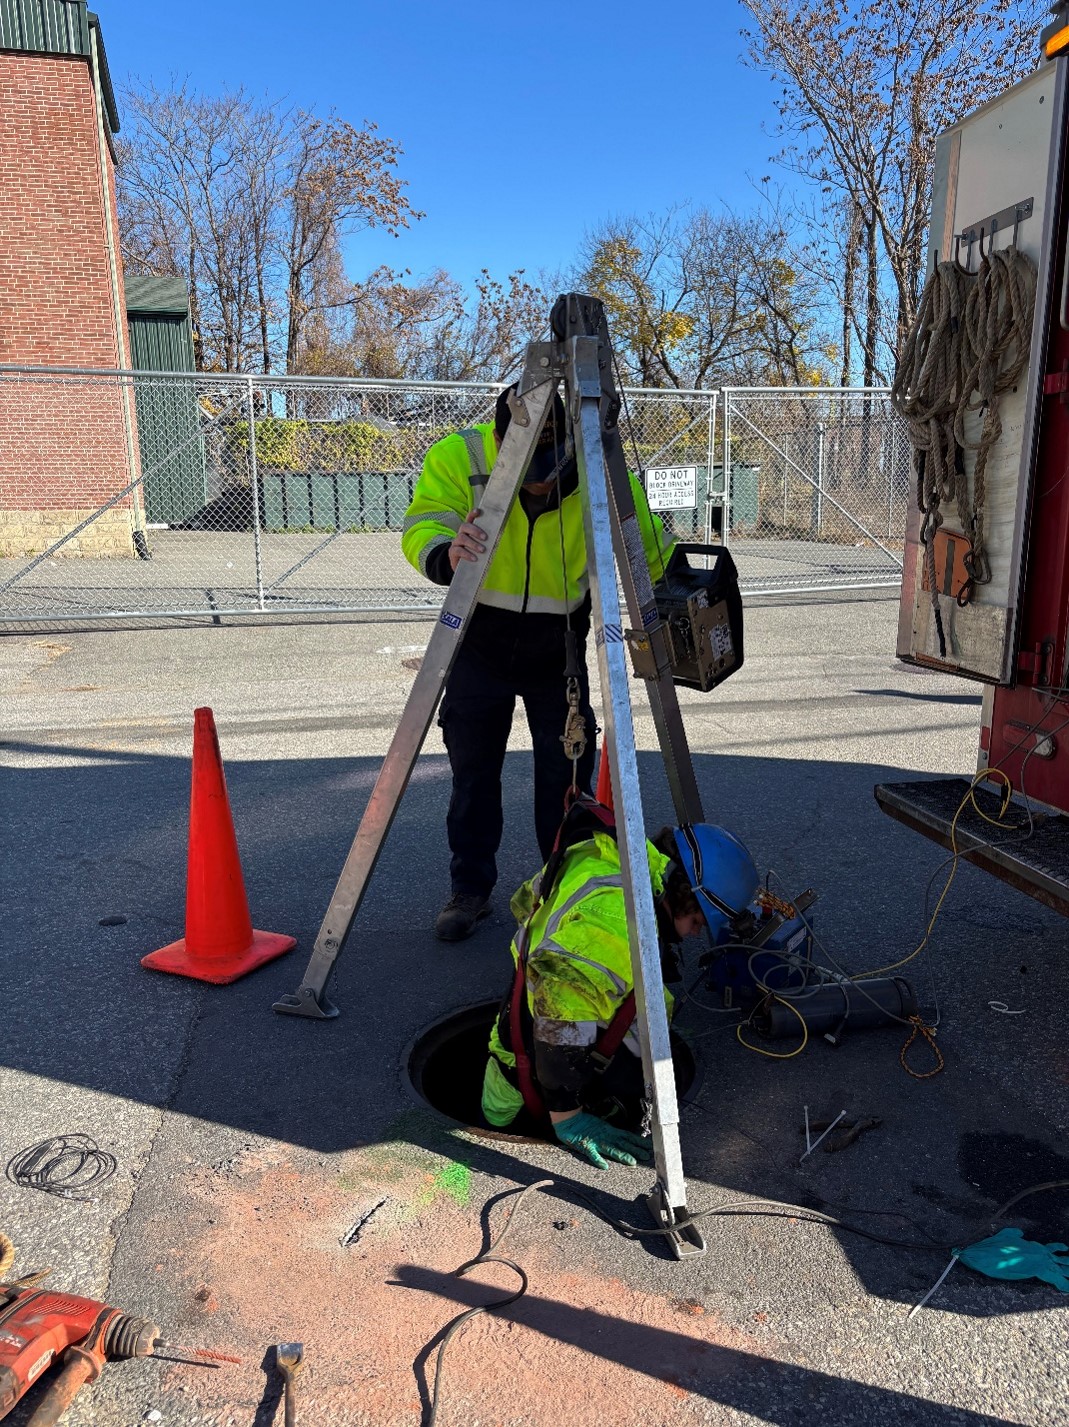
Now lets apply these concepts to different places in south Lawrence east. When rain falls in Den Rock Park it enters a highly efficient management system that functions like an umbrella, a filter, and a sponge. The forest slows down and spreads out the rainwater and it eventually drains into the Shawsheen River or absorbed by trees. When rain falls at Plaza 114 (between South Union Street and Winthrop Street), it hits roads, driveways, and roofs. Since it can’t soak in, it flows toward catch basins and through a series of stormwater sewers and eventually discharges to the Shawsheen River behind South Lawrence East Elementary School. When too much rain falls in this section of the city undersized stormwater sewer pipes and too much pavement can result in severe flooding.
Den Rock Park is Lawrence’s largest park with over 80-acres of forests and wetlands.
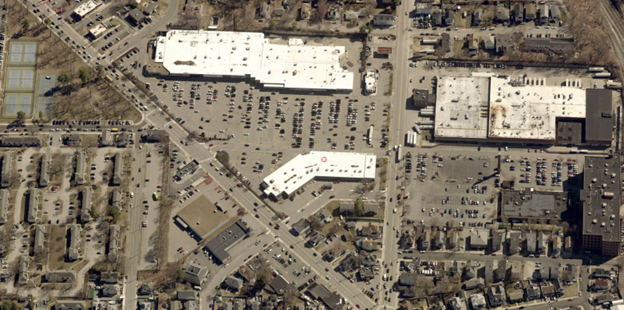
Plaza 114 is a 12-acre shopping center with minimal open space.
Flooding in south Lawrence east.
The neighborhoods around Plaza 114 have a history of resident complaints about severe flooding when it rains. Prior to this section of the city being developed it was mostly open space drained by Cold Spring Brook. As Lawrence grew the brook was first channelized into a culvert which was later buried into a 3-foot by 3-foot pipe that is simply not large enough to manage stormwater in the neighborhood. Heavy downpours frequently overwhelm the infrastructure in this section of the City, leading to flooding.
Calibrating the model
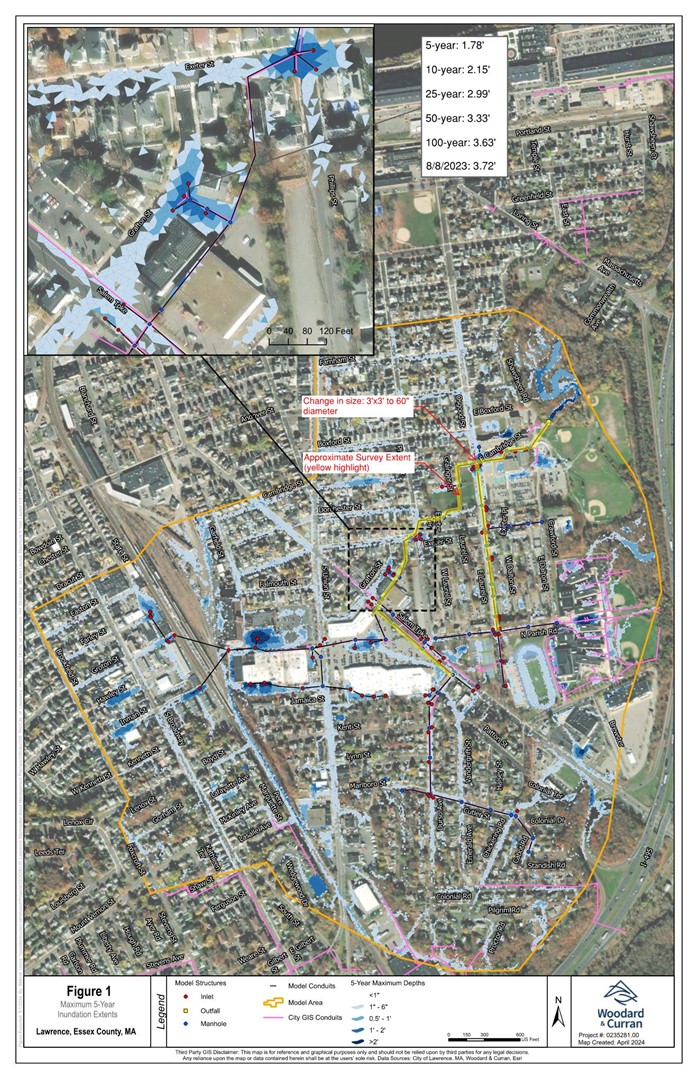
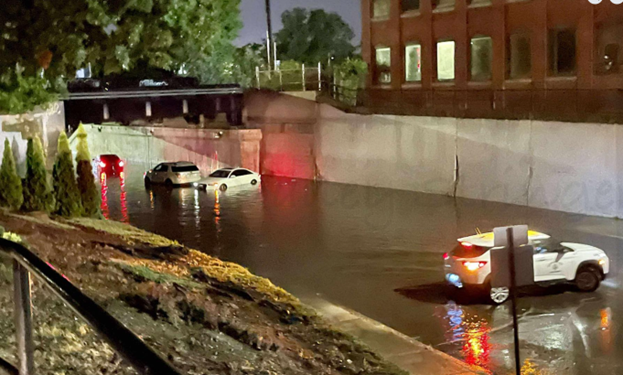
The Grafton Street area has experienced numerous flooding events in recent years, with the most intense occurring on August 8, 2023, when the Lawrence received 6.2 inches of rainfall in one day. The area has been identified as a high-priority area for the City and was therefore selected as a benchmark area to study the City’s digital model of the sewer system. The team can use available flood observations with the modeling results to make sure the model is calibrated.
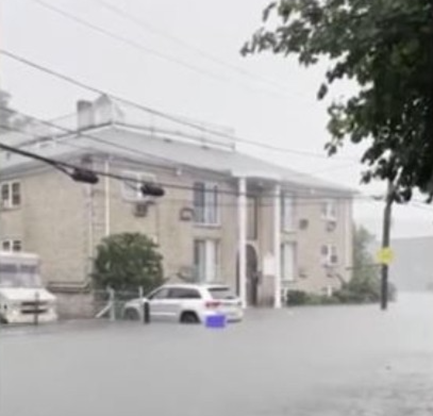
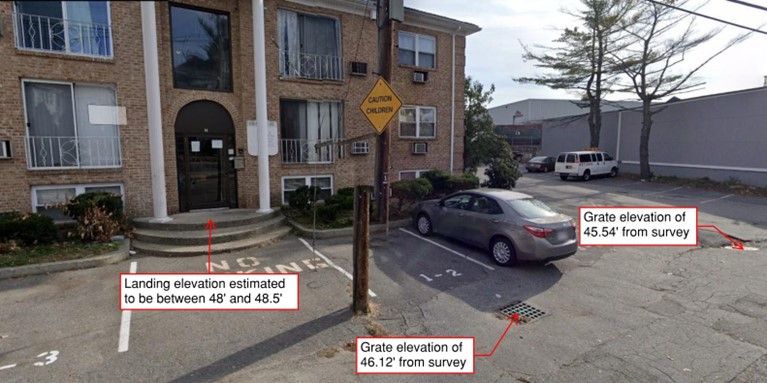
Photographs and videos from August 8, 2023, showed that the water level reached the landing of the apartment building located at 10 Grafton Street, as seen above. The elevation of the step landing is estimated to be between 48 and 48.5 feet. The peak water surface elevation simulated by the model at that location on August 8, 2023, is 48.24 feet, indicating that our tools can replicate observed results well.
What’s next?
The digital model will be used to predict issues in advance of a storm event to allow the City’s emergency response teams time to prepare and notify residents of impending flood areas.
Currently the City team is developing computer programs to track rain storms as they approach the City. As the storm event gets closer, predicted rainfall depths can be used in the model to simulate where, when and how much flooding may occur. The image below shows a current version of the “dashboard” that the City will use to identify likely areas of concern, based on the weather forecast.
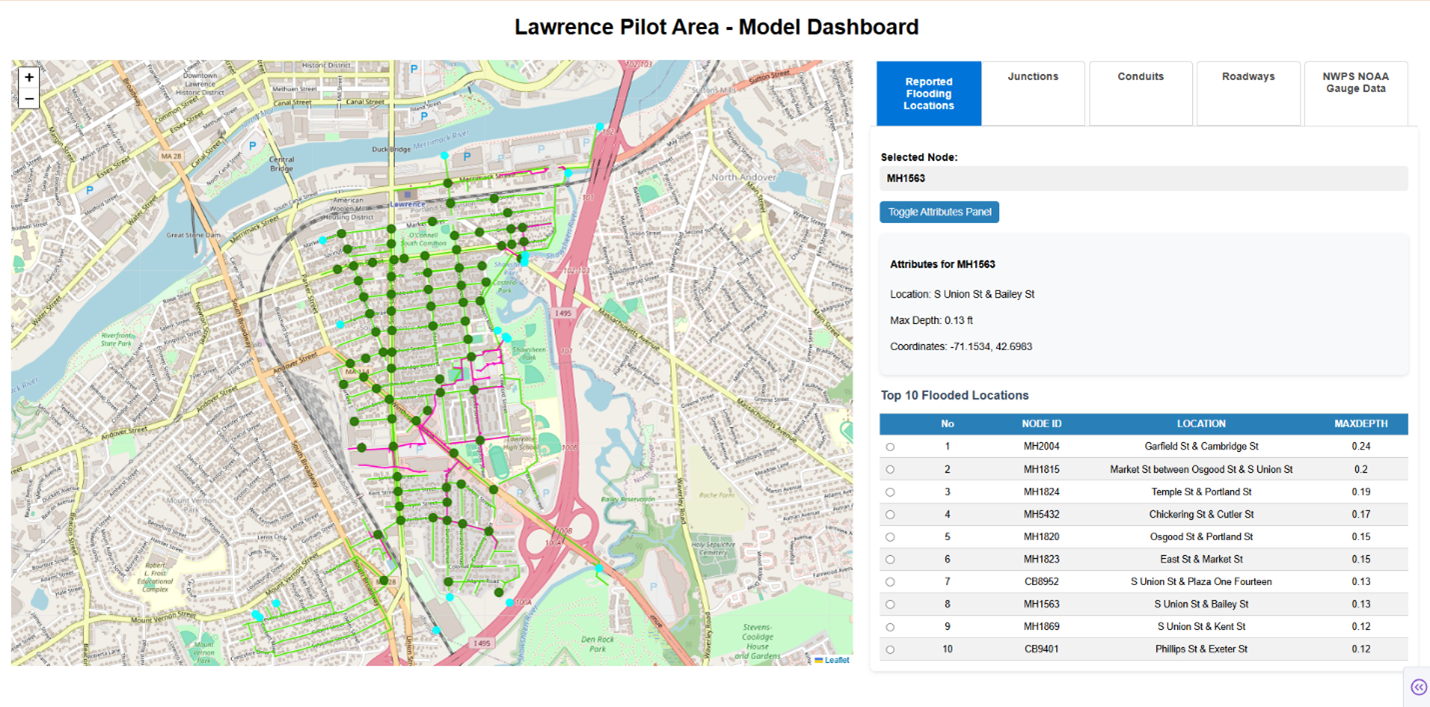
This tool will be developed for certain areas of the City known to be problematic during heavy rains. One goal of this effort is to identify projects that will reduce flooding; another goal is to “get ahead of the storm” to avoid scenes like these in the meantime.
The City team will continue refining these tools through the spring, with additional work underway on identifying various solutions to problem-flooding areas in the City.