Hydrologic and Hydraulic Model
Year 1 Model Results: As part of the Year 1 project work, the City developed an initial hydrologic and hydraulic model that integrates Lawrence's sewer and stormwater collection systems. This computer-based model can be thought as a digital representation of the City, and is able to simulate what happens during rainfall events. If a storm event results in a lot of rain and the sewer or stormwater pipes underground get too full, flooding of streets and properties, as well as the combined sewer overflows that discharge to the Merrimack River can happen. The model helps us see when and where this might happen.
Year 2 Model Next Steps: Now that the initial model has been developed, the engineering team will calibrate it to enhance its ability to replicate flooding known to have occurred within the City during past rainfall events. This will be done by making changes to the model using information collected with the flow meters we put in last year. 20 flow meters were installed throughout the City to collect information when it rains. Once calibrated, the model will be used to identify opportunities to reduce sewer surging and overflows, with an emphasis on green stormwater infrastructure. Additionally, the model will be used to predict issues in advance of a storm event to allow the City's emergency response teams time to prepare and notify residents of impending flooded areas.
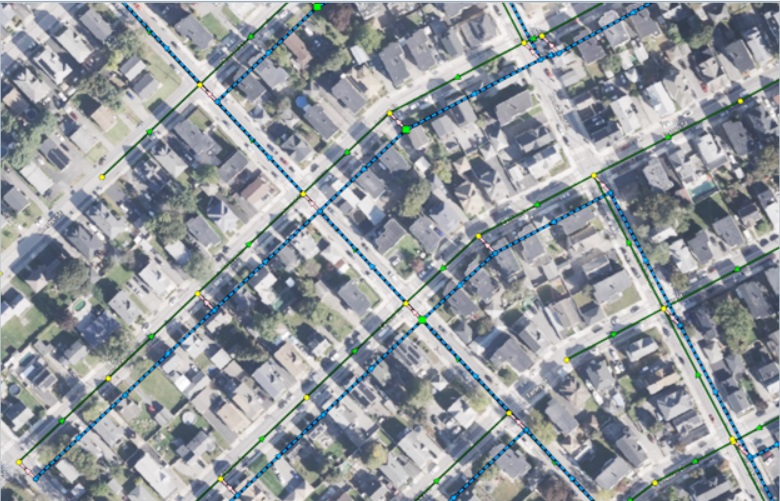
Above is a picture of the model interface, which can be thought of as a digital representation of the City. The combined sewer system that conveys sanitary and stormwater flows underground is shown in the green lines. The blue lines represent the streets that convey water unable to enter the underground system when the pipes are too full.
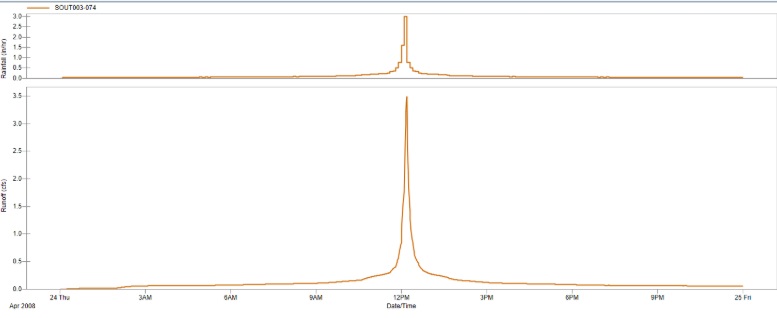
The above graphs show the hydrologic component of the model: When it rains, some of the water soaks into the ground, and the rest of the water runs off onto the streets. The top graph shows the rainfall being applied to the model, and the bottom graph shows the resulting runoff.
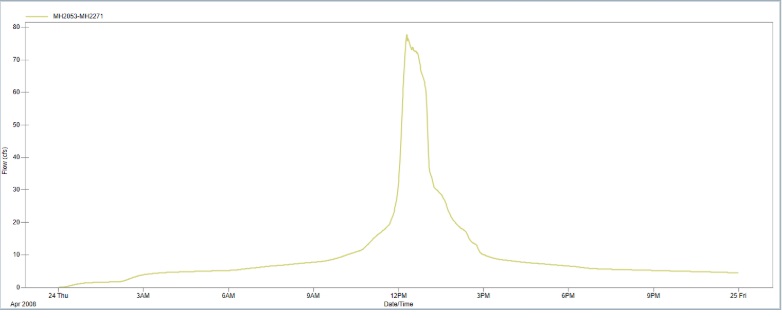
This graph shows the hydraulic component of the model: Water traveling on the streets goes into the underground sewer and stormwater collection system through catch basins. The graph shows water flowing through a pipe.
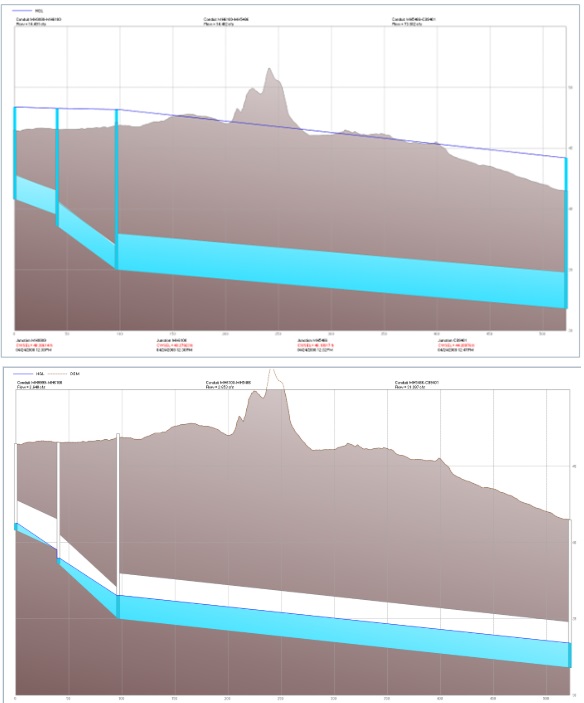
These figures shows the profile of an underground stormwater pipe for two different rainfall events, with the water level shown in blue. These profiles show that the pipes are large enough to convey stormwater from the first rainfall event, but not the second which leads to water ponding on the streets. These profiles are one of the tools that can be used to identify problem areas and investigate solutions.